hsEPDnew, the Homo sapiens (human) curated promoter database

Version 006
Coverage 29598 promoters 16455 genes
Genome assembly H. sapiens (Dec 2013 GRCh38/hg38)
Gene annotation Gencode (v28)
Based on data from Riken/ENCODE CAGE data downloaded from UCSC
FANTOM5 data
Rampage data
EPD (old)
Documentation & Viewer(s) Promoter assembly pipeline description
EPD viewer - hg38 (track content)
EPD viewer - hg19 (track content)
GM12878 viewer (hg19)
FANTOM5/ZENBU (hg38)
DBTSS/KERO (hg38)
refTSS (hg38)
SwissRegulon (hg19)
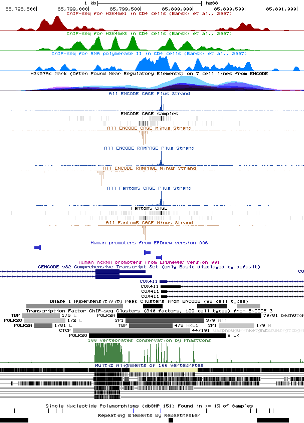
Promoter example
Promoters shown above: EMC8 and COX4I1.

Promoter Selection and Anaysis tools

Various tools allow you to analyse promoters from EPD and/or to select subsets of promoters. In order to analyze the complete EPD promoter set, go directly to one of the analysis pages. If you prefer to first select a subset of promoters, go to one of the selection pages. From the output of the selection pages you can then directly navigate to one of the analyses pages, or you can continue with another selection page to refine your promoter selection.

Selection tools
  • EPD selection tool: Promoter subset selection based on EPD-supplied annotation.
  • ChIP-Cor: Promoter subset selection based on experimental data or genome annotations residing in the MGA repository. Example: select promoters that have more than 100 H3K4me3 ChIP-seq tags data between -100 and +100 relative to the TSS.
  • FindM: Promoter subset selection based on DNA motif occurrences. Example: select promoters that have (or do not have) a c-Myc binding site between -100 and +100 relative to the TSS.
Analysis tools
  • ChIP-Cor : Generation of an aggregation plot (feature correlation plot) for a specific chromatin of genome annotation features. Example: Distribution of nucleosomes (MNase-seq tags) near promoters, e.g. from -1000 to +1000 relative to the TSS.
  • ChIP-Extract : Extraction of specific chromatin features around each promoter in table format. The output is a table with rows representing each promoter and columns the feature tag occurance at a specific distance. Example: Distribution of nucleosomes (MNase-seq tags) near each promoter, e.g. from -1000 to +1000 relative to the TSS. Useful for downstream analysis in R, for example to classify promoters according to differences in feature distribution.
  • OProf : Generate a motif occurrence profile around TSS positions. Example: Generate a plot showing the occurrence frequency of TATA boxes between -100 to +100 relative to the TSS.
  • FindM : Extract DNA motif positions near transcription start sites. Example: extract coordinates of CCAAT boxes located between -150 and -50 relative to a TSS. The output is a set of CCAAT-box positions that can be further analyzed in the same way as a set of TSS positions.
How-To Documentation: OProf, FindM and ChIP-Cor.

Database quality control

Core promoter elements' enrichment

Core promoter element analysis is performed in order to investigate the quality of the promoter collection. It leverages the preferential occurrence of certain DNA motifs at characteristic distances from the TSS. For instance, TATA boxes occur in a narrow region centered about 28 bp upstream of the TSS, whereas the CCAAT box occurs in a much wider area, with a maximal frequency at position -80. Based on these observations, a high-quality promoter collection is expected to show high peaks for both motifs. In addition, a narrow TATA box peak at -28 would indicate precise TSS mapping. This analysis has been performed using OProf. EPD users are encouraged to repeat this analysis and to perform others in order to check the quality of the promoter list.

TATA-box: this core promoter element is normally found 28 bp upstream the transcription start site. The following plot shows that EPDnew promoter collection has a more focused TATA-box distribution compared to the Gencode annotation, suggesting a precise TSS mapping in EPDnew.

Initiator: it is found at the TSS and shows a great enrichment in EPDnew compared to the Gencode promoter collection.

CCAAT-box: is found more up-stream of the TSS compared to the other core promoter elements. EPDnew shows an enrichment in this elements as well.

GC-box: as in the other cases, EPDnew shows an enrichment in this element compared to the Gencode collection.

Last update October 2019